Thermodynamic behavior
Vapor/liquid equilibria
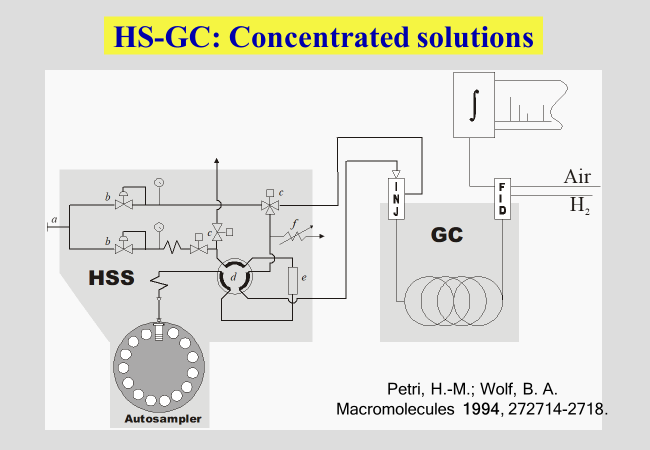
The measurement of vapor pressures has become comparatively simple by the development of an automated procedure 1. It combines head-space sampling with gas-chromatography and provides access to Flory-Huggins interaction parameters, \(\chi\), particularly in the range of higher polymer concentrations. If additional information from other methods, like osmometry or light scattering is available, it is possible to cover the entire range of composition.
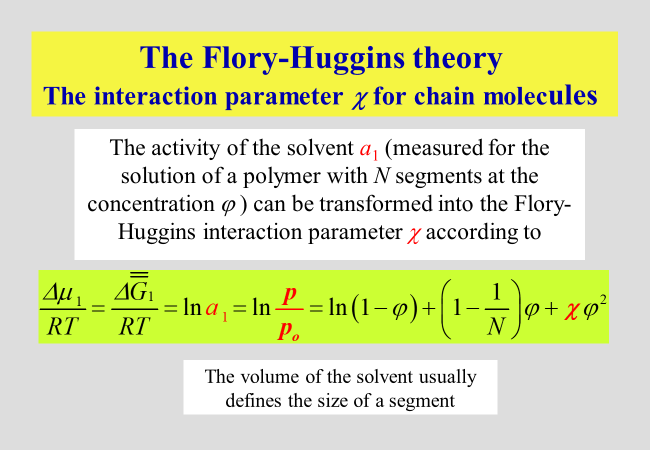
The reduced vapor pressure (more strictly speaking, the fugacity accounting for the non-ideality of the gas phase) constitutes the activity \({a_1}\) of the solvent, which is related to the original definition of the Flory-Huggins interaction parameter \(\chi\) as shown in the next chart. \(\varphi\) are volume fractions and N is the number of polymer segments, identical in their volume to that of the solvent molecule. \({\overline{\overline G} _1}\) stands for the segment molar chemical potential of the solvent
The evaluation of measured activities according to the above equations with respect to \({a_1}\) has demonstrated that reality is much more complicated than the original theory had expected. Numerous refinements have therefore been proposed as discussed in the section dealing with interaction parameters.
Some reduced vapor pressures, typical for different types of macromolecular systems, are mapped below. The curves connecting the data were modeled by an approach we called "unified" because it describes virtually all systems we studied so far quantitatively.
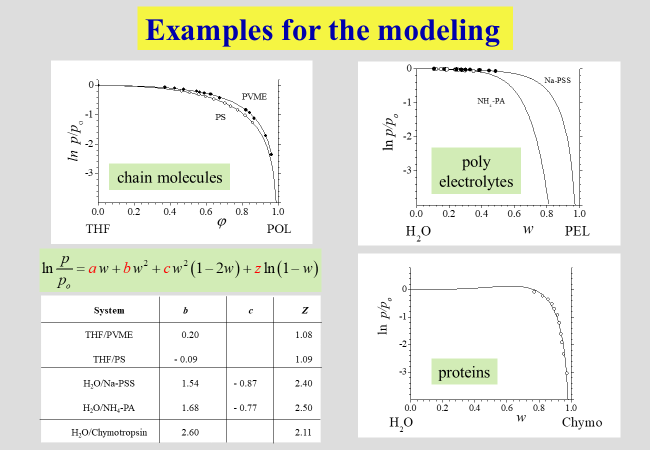
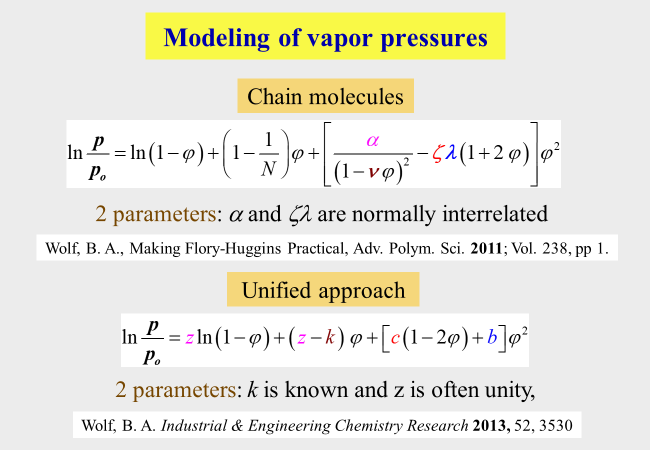
The details of this more phenomenological unified approach are shown below together with another expression for chain molecules based on molecular considerations, which will be discussed later. \(\alpha\), \(\beta\), \(\zeta\), \(\lambda\), z, k, b and c are system specific parameters.
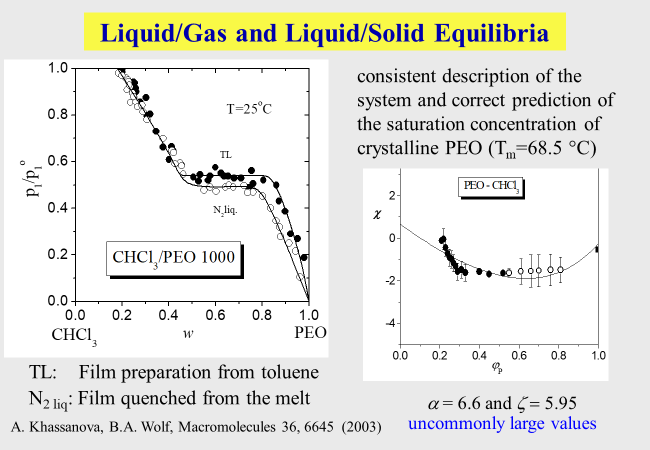
The following example for the composition dependence of vapor pressures refers to macromolecules, which are homogeneously soluble in a given solvent at low polymer concentrations, but crystallizes as a characteristic value is surpassed; PEO: polyethylene oxide.
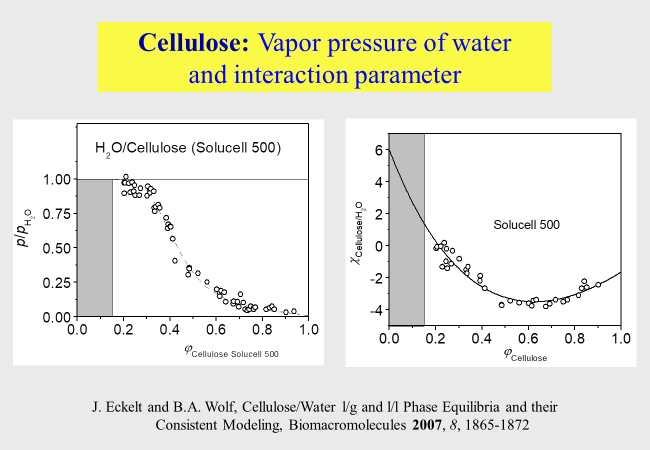
Head-space sampling in combination with gas-chromatography also turned out useful for the study of biopolymers, like bovine serum albumin 2, cellulose 3 4 or pullulan and dextran 5. The results for cellulose are shown below. This polymer can take up huge amounts of water, but there exists a miscibility gap on the solvent side of the system, which impedes the formation of homogeneous dilute solutions. The subsequent chart shows the details.
Numerous studies of polymers with different chemical composition and/or molecular architecture have uncovered interesting new features, like \({a_1}\) values, which depend on chain length even in the range of high polymer concentration 6 7. Another unexpected item concerns the preferential evaporation of the precipitant from mixed solvents 8.
The HS-GC 1 method also turned out helpful to study typical differences in the thermodynamic behavior of random copolymers 9 10 or block copolymers 11, as compared with the corresponding homopolymers. Moreover, it was possible to assess effects of molecular architecture, by comparing the solution behavior of randomly branched macromolecules 12 13 and of star-like polymers 14 with that of their corresponding linear counterparts.
-
Petri, H. M., & Wolf, B. A. (1994). Concentration-Dependent Thermodynamic Interaction Parameters for Polymer-Solutions - Quick and Reliable Determination Via Normal Gas-Chromatography. Macromolecules, 27(10), 2714–2718. ↩ ↩
-
Antonov, Y., Eckelt, J., Sugaya, R., & Wolf, B. A. (2013). Liquid/Gas and Liquid/Liquid Phase Equilibria of the System Water/Bovine Serum Albumin. Journal of Physical Chemistry B, 117(18), 5497–5502. ↩
-
Eckelt, J., & Wolf, B. A. (2007). Cellulose/Water: Liquid/Gas and Liquid/Liquid phase equilibria and their consistent modeling. Biomacromolecules, 8(6), 1865–1872. ↩
-
Eckelt, J., Richardt, D., Schuster, K. C., & Wolf, B. A. (2010). Thermodynamic interactions of natural and of man-made cellulose fibers with water. Cellulose, 17(6), 1079–1093. ↩
-
Eckelt, J., Sugaya, R., & Wolf, B. A. (2008). Pullulan and dextran: Uncommon composition dependent Flory-Huggins interaction parameters of their aqueous solutions. Biomacromolecules, 9(6), 1691–1697. ↩
-
Petri, H. M., & Wolf, B. A. (1995). Composition-Dependent Flory-Huggins Parameters - Molecular-Weight Influences at High-Concentrations. Macromolecular Chemistry and Physics, 196(7), 2321–2333. ↩
-
Petri, H. M., Schuld, N., & Wolf, B. A. (1995). Hitherto Ignored Effects of Chain-Length on the Flory-Huggins Interaction Parameters in Concentrated Polymer-Solutions. Macromolecules, 28(14), 4975–4980. ↩
-
Barth, C., & Wolf, B. A. (2000). Preferential evaporation of precipitants from polymer solutions in mixed solvents. Macromolecular Rapid Communications, 21(7), 349–353. ↩
-
Bercea, M., Eckelt, J., & Wolf, B. A. (2008). Random copolymers: Their solution thermodynamics as compared with that of the corresponding Homopolymers. Industrial & Engineering Chemistry Research, 47(7), 2434–2441. ↩
-
Bercea, M., & Wolf, B. A. (2015). Dependence of solvent quality on the composition of copolymers: experiment and theory for solutions of P(MMA-ran-t-BMA) in toluene and in chloroform. Soft Matter, 11(3), 615–621. ↩
-
Xiong, X. P., Eckelt, J., Zhang, L., & Wolf, B. A. (2009). Thermodynamics of Block Copolymer Solutions As Compared with the Corresponding Homopolymer Solutions: Experiment and Theory. Macromolecules, 42(21), 8398–8405. ↩
-
Samadi, F., Eckelt, J., Wolf, B. A., Schule, H., & Frey, H. (2010). Branched Versus Linear Oligo(dimethylsiloxane): Differences in Their Thermodynamic Interaction with Solvents. Journal of Polymer Science Part B-Polymer Physics, 48(12), 1309–1318. ↩
-
Eckelt, J., Samadi, F., Wurm, F., Frey, H., & Wolf, B. A. (2009). Branched Versus Linear Polyisoprene: Flory-Huggins Interaction Parameters for their Solutions in Cyclohexane. Macromolecular Chemistry and Physics, 210(17), 1433–1439. ↩
-
Xiong, X. P., Eckelt, J., & Wolf, B. A. (2012). Linear versus Three-Arm Star Polybutadiene: Effects of Polymer Architecture on the Thermodynamic Solution Behavior. Macromolecules, 45(23), 9539–9546. ↩